Wondering whether the renewable energy transition is really on track? You’ll find it is moving at record speed, yet still behind its 2030 goal, held back mainly by grids, storage and uneven investment.
This guide sits within our wider sustainability coverage, which looks at how global environmental and social trends connect.
| Item | Value |
|---|---|
| Renewable capacity added worldwide in 2025 | 692 GW |
| Total renewable capacity worldwide, 2025 | 5.14 TW (49% of installed power capacity) |
| Solar additions in 2025 | 511 GW |
| Wind additions in 2025 | 159 GW |
| Renewables’ share of new power capacity in 2025 | 85.6% |
| Global renewable capacity goal for 2030 | 11.2 TW |
These figures come from IRENA’s Renewable Capacity Statistics 2026 as reported by Impakter, and from the September 2026 tracking report covered by Bioenergy International. Figures can change as data is revised, so check the source before you rely on them.
How far has the renewable energy transition come?
The headline is strong. IRENA’s Renewable Capacity Statistics 2026, covered by Impakter in April 2026, found that a record 692 GW of renewable capacity was added worldwide in 2025, taking the total to 5.14 terawatts, or 49% of global installed power capacity.
That figure measures installed capacity: the panels, turbines and dams that exist and could, in theory, run at full power at the same time. It does not tell you how much renewable electricity actually flows through the grid, as Impakter points out.
Generation data tells a more modest story. Global Government Forum reports that renewables supplied 31.7% of the electricity generated worldwide in 2024, and that renewable generation grew 9.8% that year against 1.4% for non-renewable sources. The years differ from the capacity figure, so treat the two numbers as a rough guide to the gap between what is built and what is used.
Why solar and wind do most of the work
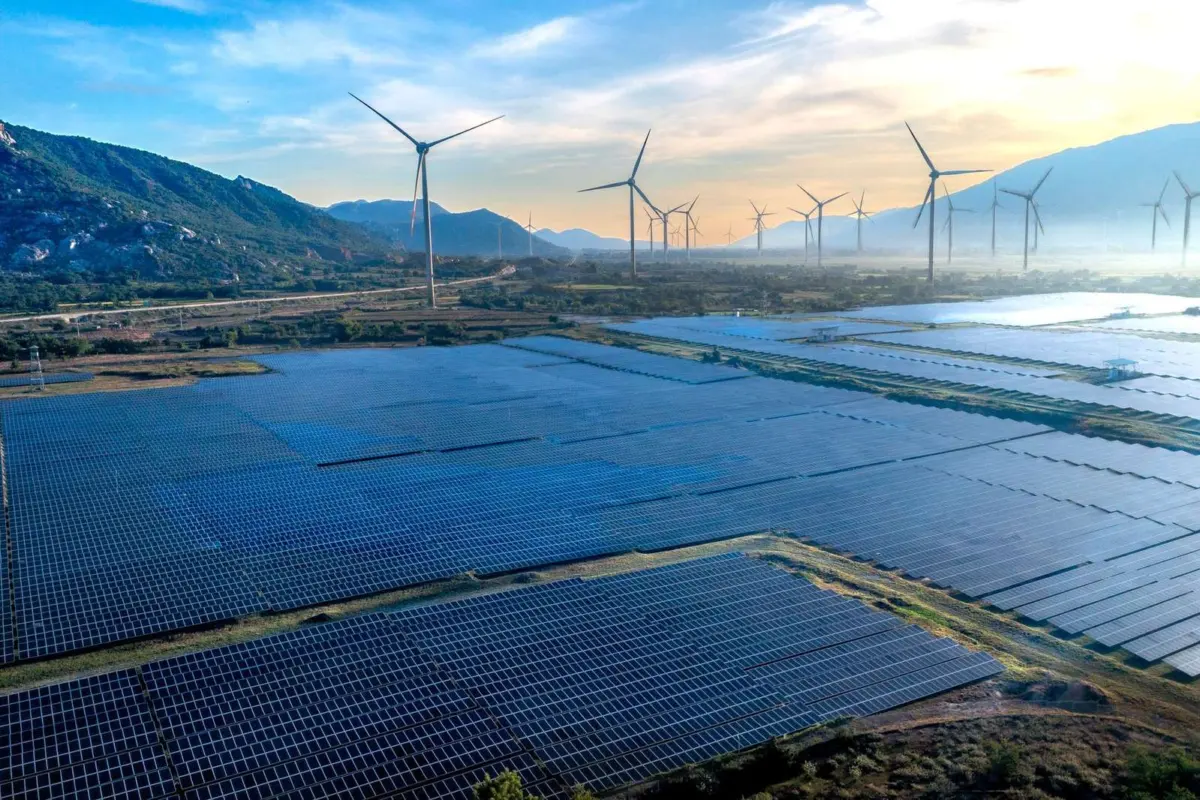
Solar added 511 GW of the 692 GW built in 2025, roughly 75% of new renewable capacity, while wind added 159 GW, according to Impakter. Technical Review Middle East adds that the two technologies together made up nearly 97% of new renewable installations, with hydropower adding 18.4 GW and bioenergy 3.4 GW.
Cost is the main reason. The September 2026 tracking report, covered by Bioenergy International, says renewables were the most cost-competitive source of new electricity in most markets in 2025. It also reports that battery storage costs fell by 30 percent between 2024 and 2025 and by 95 percent since 2010.
Pairing solar with batteries is moving into the mainstream. Co-located solar and storage made up around one-quarter of utility-scale solar commissioned globally in 2025, according to the same Bioenergy International coverage.
Hydropower tells the opposite story. Impakter notes that it adds almost no new installations because the technology depends on location and most suitable sites are already used.
Who is building the capacity, and who is being left out?
Asia accounted for 74.2% of all new renewable capacity in 2025, according to Impakter. That raises a fair question: is this a global shift or a regional one? Other regions show a mixed picture:
- Africa: a record 11.3 GW added, a 15.9% rise on the previous year, driven by Ethiopia, South Africa and Egypt.
- Middle East: growth of 28.9% year on year, led by Saudi Arabia.
- Central America and the Caribbean: a combined total of just 2 GW of renewable capacity.
Percentage growth in smaller markets is encouraging, but raw volumes remain far behind Asia. IRENA warned, as reported by Technical Review Middle East, that such imbalances could leave certain economies more vulnerable to energy supply disruptions and price shocks.
The barriers: grids, money, efficiency and demand
Record building has not removed the bottlenecks. The September 2026 tracking report says energy efficiency is falling behind, electricity demand is rising faster than expected, and grid infrastructure has failed to keep pace with renewables deployment, as covered by Bioenergy International.
- Grids: the report urges investing nearly USD 1 trillion annually between 2026 and 2030, more than double 2025 levels (Bioenergy International).
- Finance: a joint IRENA report published on Oct 15, 2025 urged scaling investment in renewables to at least USD 1.4 trillion per year in 2025-2030, more than doubling the USD 624 billion invested in 2024 (Oman Observer).
- Efficiency: energy intensity improved by around 2 percent in 2025, far below the 4 percent needed (Bioenergy International).
- Fossil growth: renewables were 85.6% of power capacity expansion in 2025, down from 92.5% in 2024, so non-renewable capacity grew too (Impakter).
The Impakter analysis puts the lesson plainly: installed capacity is a promise, not a delivery. Whether it delivers when the sun sets or the wind drops depends on storage, grid investment and political will, as the Impakter piece argues.
Trade-offs and what the 2030 goal demands
The COP28 UAE Consensus set a goal of tripling renewables to 11.2 TW by 2030. As of the September 2026 tracking report, installed capacity must more than double, which means about 1,200 GW added on average each year between 2026 and 2030, according to Bioenergy International.
The same report says the world must build more renewable power capacity in 2026 to 2030 than in all previous years combined. It expects solar and wind to account for around 62 percent of installed power by 2030, up from 35 percent in 2025 (Bioenergy International).
Reaching that goal involves real trade-offs:
- Speed versus balance: fast growth is concentrated in Asia while some regions lag.
- Capacity versus reliability: more panels and turbines do not guarantee supply without storage and stronger grids.
- Security versus fossil investment: IRENA’s Director-General Francesco La Camera argued that countries investing in the energy transition weather geopolitical volatility with less economic damage, yet fossil capacity also grew in 2025 (Impakter).
- Supply chains: the October 2025 report called for fair and transparent trade practices for critical renewable energy technologies (Oman Observer).
Electrification adds another layer. Global Government Forum reported in July 2026 that Türkiye’s ambition of a 35% global electrification target by 2035 would require renewables to reach 78% of electricity generation, around 2.5 times the level at that time.
Clean power is a mitigation tool, and the guide to climate adaptation vs mitigation explains how it differs from preparing for climate impacts. The explainer on what is a carbon footprint shows how everyday energy use turns into emissions.
Frequently asked questions
Does 49% renewable capacity mean half of the world’s electricity is renewable?
Show answer
No. The 49% figure describes installed capacity at the end of 2025, as explained by Impakter. Actual generation is lower: renewables supplied 31.7% of global electricity in 2024, according to Global Government Forum.
Why is solar growing faster than other renewables?
Show answer
Cost and ease of building. Impakter describes solar as the cheapest renewable source and reports 511 GW of new solar in 2025, while hydropower depends on suitable locations that are mostly taken.
Is the world on track to triple renewables by 2030?
Show answer
Not yet, as of the September 2026 tracking report. It says annual additions would have to average about 1,200 GW between 2026 and 2030, well above the record pace of 2025, according to Bioenergy International.
What is the biggest obstacle to a faster transition?
Show answer
Grids, storage and finance are the recurring bottlenecks. The September 2026 report urges nearly USD 1 trillion a year of grid investment between 2026 and 2030, per Bioenergy International.